


Predictive Touring: Using AI to Decide Where You Should Play Before You Book the Show


Making a Scene Presents – Predictive Touring: Using AI to Decide Where You Should Play Before You Book the Show
Listen to the Podcast Discussion
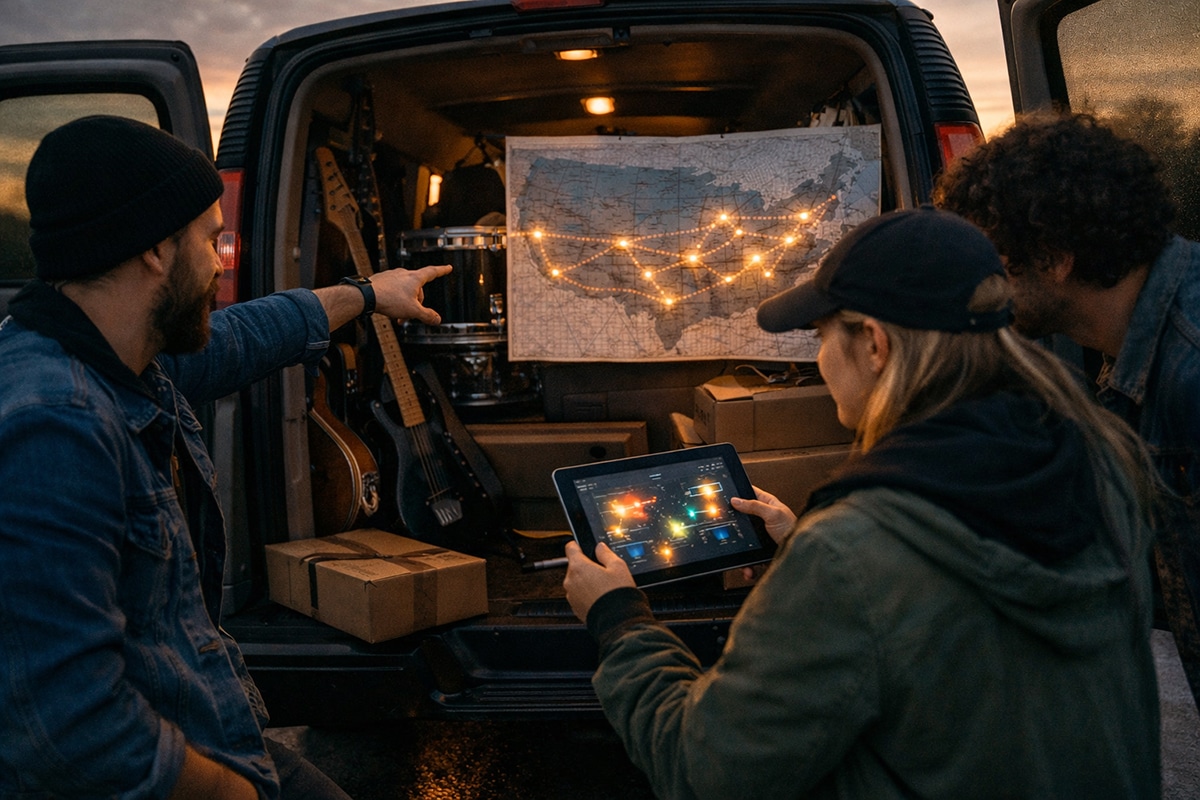
There used to be a standard indie-touring ritual. You stared at a map, circled cities you had heard were “good markets,” texted a few friends, checked which clubs had an open Thursday, and called it strategy. Then came the long drive, the half-full room, the weak merch table, the gas bill, the post-show talk where everyone said, “It was still good exposure,” which is music-business language for “the math did not work.”
That old way is not brave. It is lazy. Or, more accurately, it is what artists were forced to do when the people with the good data kept it for themselves.
Now the wall is cracking. An indie artist can look at streaming geography, social engagement, ticket-click behavior, search interest, audience segments, and most important of all, owned fan data, before they ever email a promoter. AI can take that messy pile and help turn it into a map. Not a fantasy. Not a guarantee. A map. A risk map. A money map. A “where are my real people actually concentrated?” map.
That is what predictive touring is. It is not some giant-label black box. It is the simple but powerful act of combining signals before you spend money. It is using AI to rank cities, compare routing options, and separate loud vanity from quiet demand. And if you do it right, it becomes one more way indie artists stop acting like content suppliers for platforms and start acting like owners building a middle-class business.
The Real Question Is Not “Where Am I Streaming?”
The real question is, “Where can I sell tickets without lighting money on fire?”
That sounds obvious, but a lot of artists still confuse attention with demand. A city can stream your song all day and still ignore your show. Another city can look smaller on paper and quietly be your strongest live market because the people there save your songs, open your emails, click ticket links, buy shirts, and come back the next time. Predictive touring lives in that difference.
This is why streaming-only logic is dangerous. Streaming is top-of-funnel data. It tells you where ears are. It does not, by itself, tell you where commitment lives. It does not tell you who bought merch, who drove forty minutes to a club, who dragged two friends with them, or who would show up again if you returned in six months. That is the gap the old system loves, because if artists never connect listening data to owned relationship data, they stay dependent on middlemen forever.
So let’s say it straight: streaming is a clue, not a verdict. Spotify can point you toward a city. Your owned fan system tells you whether that city is worth the van, the hotel, the split, the drummer’s dinner, and the risk.
What Predictive Touring Actually Means
Predictive touring is just pattern recognition with consequences.
At the indie level, you do not need a data science team. You need a stack of signals and a disciplined way to score them. AI then helps you clean the data, compare cities, spot clusters, identify false positives, and turn all that into a route that makes practical sense.
The core inputs are available right now. Spotify for Artists shows top cities, audience stats, source-of-streams information, and audience segments. Spotify’s support docs also make clear that audience-level stats go back two years, but listener demographics and location data are only available for the last 28 days, which means city snapshots are useful but short-lived. Spotify also separates active sources, where listeners intentionally chose your music, from programmed sources, where Spotify or another listener put the music in front of them. That distinction matters more than most artists realize.
Chartmetric is where the picture gets wider. Its Audience Location table shows top cities and countries across platforms, and its audience tools can summarize top cities and countries alongside growth and engagement across platforms such as Spotify, Instagram, TikTok, and YouTube. Chartmetric’s own product materials also describe City Affinity as a way to find places where your audience is disproportionately concentrated compared with city population and average artist distribution. That is exactly the kind of signal touring decisions need, because a true hotspot is not always the biggest city on the list. Sometimes it is the city where your audience is unusually dense and unusually alive.
Then you add live-intent tools. Bandsintown for Artists says its Insights tools show top markets, ticket clicks, RSVPs, and more by location. Songkick Tourbox says it helps artists find the right cities and venues, while Songkick support says its insights include trackers segmented by city, tracker growth per city, monthly tracker growth, and last-played data. Pollstar and Pollstar Data Cloud are more premium and more industry-facing, but Pollstar says the database includes box office, route book, venue capacity, sell-through, promoter, and related live data for a huge catalog of touring history. Add Google Trends and Google My Maps, and now you can check search interest by region and physically map the route from a spreadsheet.
That is already enough to build a serious DIY touring intelligence system.
Spotify Is Useful, But It Also Lies in Familiar Ways
Spotify for Artists gives artists one of the best free starting points in the business. It literally tells you the top cities where your listeners are streaming from, and Spotify’s own artist site frames that as a touring use case. It also gives you audience segments so you can separate casual listeners from stronger listeners. Spotify says monthly active listeners are the people who intentionally streamed your music from active sources, and it says listeners who actively stream a song will play that artist’s music four times more in the next six months on average. That is a big deal, because it tells you not to stare at monthly listeners like they are all equal. They are not.
But Spotify also has traps built into the way artists read it. One trap is playlist vanity. Spotify’s source-of-streams documentation breaks traffic into active and programmed sources. If a city loves you mainly because one editorial playlist or radio/autoplay surface pushed you there, that can create the illusion of market strength. If another city shows fewer total streams but more active listening, profile visits, library adds, saves, and repeat behavior, that second city may be far more valuable for a real show. Predictive touring starts getting smarter the moment you stop asking, “Where are my biggest numbers?” and start asking, “Where are my most intentional listeners?”
Another trap is recency blindness. Spotify’s listener demographics and location data are only available for the last 28 days. That means a city spike can be real, but it can also be temporary. Maybe a playlist added your track for a week. Maybe a local influencer posted you. Maybe a college campus was hot for ten days and then moved on. So if you are serious, you do not just look once. You log your city data regularly. Weekly is better than memory. A living history of your top 20 cities is worth more than one dramatic screenshot you took on release day.
This is the first place AI helps. A human sees a bunch of moving numbers. AI can compare week-over-week patterns, flag steady growers, separate one-week spikes from stable markets, and tell you which cities keep showing up across time instead of just once. That is not replacing your judgment. It is protecting it from your excitement.
Chartmetric Is Where the Fog Starts to Clear
Chartmetric matters because it lets you stop pretending Spotify is the whole story.
An artist’s real audience does not live on one platform. Some people stream. Some live on Instagram. Some are lurking on TikTok. Some watch YouTube clips. Some only wake up when there is a live date. Chartmetric’s audience tools are built around exactly that messy reality. Its help center says you can analyze top cities and countries across platforms from the Audience Location table, and its audience insights page says it summarizes top cities and countries alongside growth and engagement highlights across platforms. The Artist Plan page also says artists can see fan location, engagement rate, interests, and brand affinity, and as of late March 2026 Chartmetric’s pricing page lists an Artist Plan starting at $5 a month with yearly signup, or $9.99 month to month, with a 7-day trial. For an indie artist trying to reduce touring risk, that is one of the few subscriptions that can pay for itself quickly if it stops you from booking the wrong weekend in the wrong town.
The bigger idea is this: cross-platform geography beats single-platform bragging. If Atlanta, Charlotte, Nashville, and Richmond all show up across Spotify, Instagram, and YouTube, that cluster matters. If one city is huge on Spotify but invisible everywhere else, that is weaker. If a smaller city has unusually high City Affinity, that can be your sleeper market. The artist who understands density beats the artist who only understands size.
And that is where the Making a Scene attitude needs to kick in. Stop worshiping the big number just because it looks good on a dashboard. You do not get paid in dashboard screenshots. You get paid when enough real people in a real place care enough to leave the house.
Live-Intent Data Is the Bridge Between Listening and Buying
Once you have streaming geography and cross-platform geography, you still need proof that a city behaves like a live market.
This is why Bandsintown and Songkick matter. Bandsintown’s Insights tools track fan activity, ticket clicks, RSVPs, events, and more by location. That is not abstract attention. That is behavior leaning toward a transaction. Songkick Tourbox positions itself as a tool to find the right cities and venues, and Songkick’s own support pages say its fan insights include city-level tracker counts and growth. That gives you something streaming alone cannot: a sense of which places are raising their hands specifically around live music.
Pollstar is where you go when you want to get more serious about venue fit and historical live economics. Pollstar Data Cloud says it includes box-office and route-book data, venue capacity, tickets sold, gross, sell-through, promoters, and more, and that it is a paid service available with the Ultimate-level subscription. That makes it less beginner-friendly than Spotify or Bandsintown, but incredibly useful once you start comparing rooms, sizing a market, or checking whether a city supports the kind of venue you actually need.
Then there is Google Trends, which remains one of the simplest “is something real here?” sanity checks in the business. Google says Trends lets you explore popular searches by location, compare search terms, explore results by region, and export data. It is not music-only, but that is the point. If search interest around your artist name, song title, or even “your name + tickets” is picking up in a region, that can confirm momentum outside streaming apps.
Put bluntly, streaming says people heard you. Live-intent data says some of them might actually leave the couch.
Your Fan Passport Is the Missing Layer the Platforms Cannot Give You
This is the part the platforms do not want to matter, because this is the part that makes you less dependent on them.
A fan passport is simply a system that remembers what a fan actually did. Did they join your list? Did they buy a ticket? Did they scan a QR code at the merch table? Did they come back the next time you hit town? Did they buy vinyl in Dallas but not in Houston? Did they show up at your house concert in Raleigh and then buy a membership two months later? Platforms rarely give you that picture. Your owned system can.
Making a Scene’s own fan funnel page is built around the right instinct. The page captures first name, email, city, state, and optional mobile number, then sends the gift and a short follow-up sequence. A related Making a Scene article describes the Mas-Fan-Funnel plugin as a single-purpose splash page that captures first name, email, and city/state, then runs a four-email ladder that moves fans toward a passport-style engagement loop. That matters because once you have location plus behavior in your own hands, touring stops being guesswork and starts becoming customer analysis.
If you want to add a Web3 layer, do it because it helps the relationship, not because you want to cosplay as a startup founder. POAP describes itself as Proof of Attendance Protocol and says it lets you mint digital mementos for shared memories. Unlock Protocol says its system is built for memberships, expirations, renewals, recurring payments, email-based memberships, walletless airdrops, and Apple Wallet and Google Wallet onboarding. Guild says it helps communities track onchain and social activity, manage access, run quests, and use analytics across multiple chains and platforms. That means a fan passport can be simple, or it can be portable and programmable. Either way, the real value is not the token. It is the memory. It is the ability to know who keeps showing up, where they live, and how their behavior changes over time.
This is where predictive touring becomes a business discipline instead of a dashboard hobby. If you know your strongest listeners are in Denver, but your owned data says your repeat buyers and repeat attendees are in Fort Collins and Colorado Springs, you stop thinking like a platform and start thinking like an operator.
The DIY City Score That Changes Everything
Here is the heart of the whole method. Build a city score.
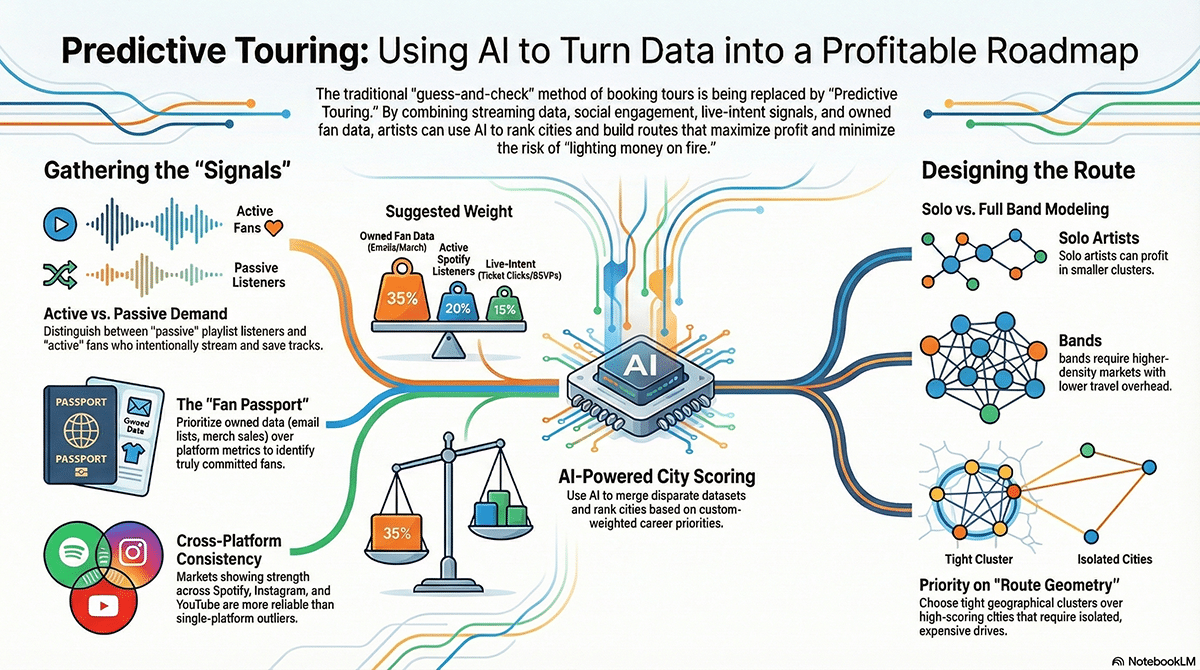
Not a fake magic score. A practical one. A score that weights the things that matter to your career. For a working indie artist, that usually means owned behavior first, intentional listening second, live-intent signals third, and route efficiency always in the room.
A simple version might look like this:
+ (Active Spotify listeners x 20%)
+ (Cross-platform city strength x 15%)
+ (Live-intent signals like RSVPs/ticket clicks/trackers x 15%)
+ (Route efficiency x 10%)
+ (Venue fit x 5%)
That is why the route matters as much as the city. AI should not just rank markets. It should cluster them. A city with a slightly lower score that sits neatly between two stronger cities may be more valuable than a higher-scoring outlier six hours off the line. Great tours are not only demand maps. They are geometry.
A Hypothetical 10-City Run, Solo vs. Band
Let’s make it real.
Imagine an Americana artist based in Georgia. Spotify says their top recent cities include Atlanta, Nashville, Charlotte, Asheville, Richmond, Washington, Philadelphia, Columbus, Chicago, and Denver. At first glance, that looks like a touring plan. It is not. It is a wish list.
Now add better signals. Chartmetric shows that Charlotte, Asheville, Richmond, and Philadelphia are strong across multiple platforms, while Chicago is big but softer on engagement. Bandsintown shows strong ticket-click behavior in Charlotte and Richmond. Songkick shows tracker growth in Asheville and DC. The fan funnel data shows that Atlanta, Charlotte, and Richmond have the highest concentration of subscribers who actually open emails and click merch links. Google Trends shows a bit of regional search heat in the Mid-Atlantic. Suddenly Denver still looks exciting, but it also looks expensive and isolated.
For a solo artist, the 10-city run might become Atlanta, Asheville, Charlotte, Raleigh, Richmond, DC, Philadelphia, Pittsburgh, Columbus, and Nashville. Why? Because the route is tighter, room sizes can stay smaller, and the weaker cities can still work if they are paired with lower overhead and high-touch selling. The solo artist can survive a mixed night if the drive is reasonable and the merch table is strong.
For a band, the same data may produce a different answer. Atlanta, Charlotte, Richmond, DC, Philadelphia, and Nashville might stay. Asheville could remain if it is paired with the right room and good pre-sold interest. Pittsburgh and Columbus might become conditional. Denver is probably out unless there is anchor support, festival logic, or a surrounding run that makes the jump rational. The band does not need more dots on the poster. The band needs fewer weak nights.
That is the adult version of touring. Not, “Where would it be cool to say we played?” but, “Which version of this route gives us the highest odds of decent rooms, good merch, manageable drives, and a repeatable return?”
The Cities That Fool Artists Over and Over
Every touring artist eventually learns there are cities that look hot and play cold.
The classic fake signal is the playlist city. You get a spike because Spotify pushed you into passive environments. The streams look great. The ticket sales do not. Another fake signal is the social city. A reel pops off locally, comments go nuts, everybody says “come here,” and then eight people buy when the link goes live. Then there is the college town problem. You caught a moment, maybe even a real one, but the audience turned over, or the energy was event-specific, or your crowd there is more casual than committed.
Owned data helps kill these fantasies. If a city streams hard but barely joins your list, barely opens your emails, barely clicks your ticket links, and never buys merch, that city is not a headline market yet. It might be an opener market. It might be an ad market. It might be a content market. It is not automatically a van market.
This is also where repeated attendance matters. A fan passport model, even a simple one, lets you spot the gold: the city where smaller numbers keep doing bigger things. The old industry trained artists to chase scale first. Independent survival usually comes from density and behavior first.
How AI Turns the Pile Into a Route
This is the good news. The analysis part is no longer hard.
ChatGPT can analyze uploaded data files, including Excel, CSV, PDF, and JSON, and OpenAI says it can merge, clean, chart, and uncover insights from those files using natural language. Google Sheets can organize and visualize the data, and Google says My Maps can import spreadsheets directly into custom maps. Airtable is useful if you want a cleaner long-term database for fan and market records. None of that requires you to become a developer. It requires you to export what you already have and stop letting it rot in separate dashboards.
The working method is simple. Pull your top-city signals from Spotify. Pull cross-platform city data from Chartmetric. Pull ticket-click or tracker behavior from Bandsintown and Songkick. Add your owned data from your email list, SMS list, merch sales, QR scans, or fan passport history. Put every city into one sheet. Then ask AI to score, rank, cluster, and stress-test the route.
The point is not to let AI make the decision alone. The point is to make it impossible for you to ignore your own evidence.
Prompts That Actually Help
Here is a prompt you can use once your city data is in one spreadsheet or CSV.
What the Best Predictive Touring Plans Do Differently
They do not chase every hot dot on the screen.
They build around clusters. They respect drive times. They match room size to behavior, not ego. They treat owned fan data as the center of gravity. They understand that a city with 300 people who know your name is often better than a city with 30,000 casual streams and no relationship. And they remember that every tour is also a data harvest.
That last part matters. Touring should not just produce ticket money and merch money. It should produce better intelligence for the next run. Every QR scan, signup, fan passport check-in, RSVP, merch sale, post-show follow, and repeat visit should make the next route smarter. This is how you get out of one-off survival mode and into compound growth.
And yes, this is where the Making a Scene attitude has to stay sharp. The old business loved when artists toured blind, marketed blind, and handed their best signals back to platforms. A dependent artist is easy to skim. An informed artist is harder to fool.
The New Touring Advantage
Predictive touring is not about removing risk. Touring will always have weather, weak nights, flaky promoters, and weird rooms with bad fries and worse load-ins.
It is about removing unnecessary risk.
It is about knowing that Spotify is a discovery engine, not your business. It is about using Chartmetric to see patterns across platforms. It is about checking whether Bandsintown and Songkick show real live appetite. It is about using Pollstar when you need deeper venue and box-office context. It is about using Google Trends and My Maps to sanity-check geography. It is about turning your own fan funnel and fan passport into the most valuable touring dataset you own. And it is about letting AI do what machines are good at: sorting noise, finding patterns, and forcing clarity.
The artist who wins the next decade is not the one with the biggest streaming screenshot. It is the one who knows where the supporters live, knows what level of date each city can support, and knows how to turn every show into stronger owned data for the next run.
That is not just better touring. That is ownership. That is how you stop gambling with your calendar. That is how you build a real working-class music business, one city at a time.
 |  Spotify |  Deezer | Breaker |
 Pocket Cast |  Radio Public |  Stitcher |  TuneIn |
 IHeart Radio |  Mixcloud |  PlayerFM |  Amazon |
 Jiosaavn |  Gaana |  Vurbl | Audius |
Reason.Fm | |||
Find our Podcasts on these outlets
Buy Us a Cup of Coffee!
Join the movement in supporting Making a Scene, the premier independent resource for both emerging musicians and the dedicated fans who champion them.
We showcase this vibrant community that celebrates the raw talent and creative spirit driving the music industry forward. From insightful articles and in-depth interviews to exclusive content and insider tips, Making a Scene empowers artists to thrive and fans to discover their next favorite sound.
Together, let’s amplify the voices of independent musicians and forge unforgettable connections through the power of music
Make a one-time donation
Make a monthly donation
Make a yearly donation
Buy us a cup of Coffee!
Or enter a custom amount
Your contribution is appreciated.
Your contribution is appreciated.
Your contribution is appreciated.
You can donate directly through Paypal!
Subscribe to Our Newsletter
Order the New Book From Making a Scene
Breaking Chains – Navigating the Decentralized Music Industry

Breaking Chains is a groundbreaking guide for independent musicians ready to take control of their careers in the rapidly evolving world of decentralized music. From blockchain-powered royalties to NFTs, DAOs, and smart contracts, this book breaks down complex Web3 concepts into practical strategies that help artists earn more, connect directly with fans, and retain creative freedom. With real-world examples, platform recommendations, and step-by-step guidance, it empowers musicians to bypass traditional gatekeepers and build sustainable careers on their own terms.
More than just a tech manual, Breaking Chains explores the bigger picture—how decentralization can rebuild the music industry’s middle class, strengthen local economies, and transform fans into stakeholders in an artist’s journey. Whether you’re an emerging musician, a veteran indie artist, or a curious fan of the next music revolution, this book is your roadmap to the future of fair, transparent, and community-driven music.
Get your Limited Edition Signed and Numbered (Only 50 copies Available) Free Shipping Included
Discover more from Making A Scene!
Subscribe to get the latest posts sent to your email.


